skip to main |
skip to sidebar
The last fortnight saw 15 cards submitted that contributed to the Cards-to-Green effort in KZN.
The bulk were in Southern KZN, with five from around Melmoth and a single one from the Newcastle area.
2729 benefited from a single submission, which means that only 10 more are needed and then all the pentads on the KZN side have at least four cards.
2831 benefited from 5 cards, bringing it's total needed down to 124. At the beginning of 2012 254 cards were needed, and at the beginning of 2013, 163.
3029 was the sole beneficiary of the 9 remaining CTG cards.
2830 is still in need of the most effort, with 318 cards needed. 2830 has three pentads with no cover and 72 with only one card.
I think that this is the first time in ages that we only have three contributor's on the CTG Merit Table.
Tim Wood and his team head the table with their great contribution of 9 cards. Of these 9, seven were the second card for their respective pentads.
John and Kim Cox are second on the table with their five cards, this time from the Melmoth area.
Last, but certainly not least, Johan de Villiers contributed a card from the Mpumalanga border.
On the general KZN front we had 57 cards submitted for KZN, down from last fortnight's 84. This represents a drop from 6.0/day to 4.1/day. We seem to average around 4/day in winter.
The records/card number also dropped from 53.7 to 43.3, so it would seem that winter is finally setting in, as this number was also in the low 40's in the fortnight prior to the last.
Thanks to all who have contributed to SABAP2.
This last fortnight again saw 14 cards submitted that contributed to the CTG effort in KZN. Last fortnight had 27 cards, but the one before also had 14 cards, or exactly one CTG card/day.
This time the spread is from around Vryheid, inland from the North Coast and some north of the Durban-PMB axis.
2831 saw the largest gain with 4 cards followed by 2730 with 3 and 2930 with 2.
2830 gained a single card so now needs 318.
2931 inched a little closer to completion with another card submitted as well, so now 15 needed there.
The credits table continues to show variation, other than John and Kim Cox and Tim Wood, who featured again.
All six observers have featured on this table before, but the line up, sorted by most cards and alphabetically is:
Duncan McKenzie with 4
John and Kim Cox also with 4
Alan Manson with 2
Tim Wood with 2
Dave Everard and Malcolm Robinson each with 1.
Thanks to these observers who have managed to target their atlasing to contribute to the CTG effort.
On the general SABAP2-KZN front we had one card less than last fortnight, so 84 in total, or 6.0/day. This means that the CTG:Total percentage dropped from 32% to 17% percent, which is still a tidy effort.
In terms of records/card we have sprung back up to 53.7 records/card from last period's 45.6, so back where we were pre-winter.
Thanks to all observers who have contributed to SABAP2.
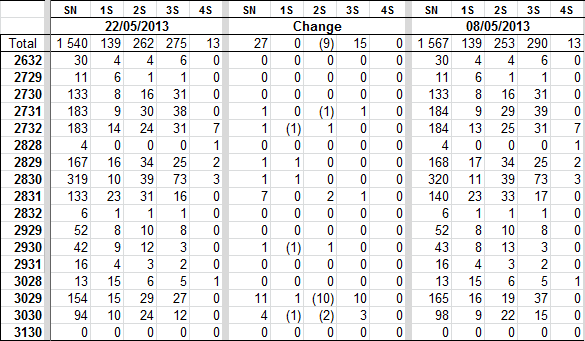
The last fortnight saw 27 CTG cards submitted. This equates to a rate of 1.9/day, a rate last achieved in January when we had 2.0/day over a period of four weeks.
Most movement was in the south, around Harding and Kokstad, with the rest on the strip in from the North Coast.
Degree square 3029 had 11 cards submitted, 10 of which were the second cards for their pentads. The second biggest degree square contribution was for 2831, where seven cards were submitted. 3030 came in third with 4 cards, again with 3 being second cards.
2830 remains our biggest challenge with 319 cards needed, and three empty pentads. Second neediest are 2731 and 2732, both needing 183 each, but 2732 has seven empty pentads.
On the upside 2832 only needs six cards to be completely "green" while 2931 needs 16 cards.
In this period we again have some fresh faces, with Johan deVilliers, Kelly Gate and Ronald Searle each contributing a card, while Ewert Hauptfleisch, who has been featuring quite regularly, also contributing a card.
Honours this fortnight certainly go to Tim Wood and his team, who contributed 16 cards. All but one of these were for Southern KZN, which has in dire need of deeper coverage.
John and Kim Cox managed a really good seven cards, continuing their methodical coverage of the area within reach of Richard's Bay.
On the general SABAP2-KZN front, we had 85 cards submitted for this fortnight. This equates to 6.1 cards/day, while slightly down on our average of 7.9/day, it is still better than we usually get at this time of year. What is really great about these 85 cards though, is that 32% of them were well targeted at "CTG" pentads.
The number of records has finally dipped to 45.6 records/card, down from the 52.5 that we had maintained since the middle of March. So winter is finally biting.
These pentad charts are a useful tool for planning atlas trips, especially as we start to add cards to pentads, these allow one to see the seasonality of submissions and so fill gaps in that way.
These maps are either available in xls format [click on the link on the right] or if you email me I can send you a pdf of the area that you are looking for. The pdf maps are only about 30KB as opposed to the 1.1MB of the xls files.
This fortnight saw the most submissions per day for Cards-to-Green in KZN since the middle of February.
We have had 14 cards submitted, two of which were for empty pentads, while another 4 were for pentads with only one card. There was also a good mix of observers, some having submitted for the first time in some years.
As we have come to expect, there was some good movement in the north, with three cards in 2732, and another in 2632.
The west also saw movement with cards in 2829, 2830 and 2929.
One card for 2930 saw this degree square continuing it's slow march to CTG closure, with only 43 cards needed now.
There was also some movement in the south with 3028, 3030 and 3130 receiving 4 cards in total and the two empty pentad cards.
The issue of which pentads are allocated to which province remains problematical as it is quite difficult to allocate these. According to my calculations we should have had 2 empties receiving cards, while according to the SABAP2 website, one of these was allocated to the Eastern Cape. In any event we have achieved better coverage for the whole of SABAP2.
The credits table also shows some good news with two observers who last submitted some years ago making a return. Welcome back Malcolm Rivett and Paul Bartho.
In fact, Malcolm leads the table this fortnight with 3 cards, followed by John and Kim Cox, Tim Wood and Trish Strachan all with 2 cards.
Alan Manson, Andy Branfield, Ewert Hauptfleisch, Lia Steen and Paul Bartho all contributed a card.
Thanks to all of these observers, these contributions are especially valued.
Looking at the overall KZN front, we have good movement in most areas. Not only has the the number of empty pentads decreased slightly, but we have had cards submitted for four pentads that only had one card. We also have 5 pentads added to those with seven or more cards, this is 28.3% of KZN's area. This keeps us quite competitive with Mpumalanga who are on 29.2% and the Western Cape on 28.5%. Both of these provinces had been drawing away from us.
In terms of daily submissions of cards we have moved right back up to 9.3 cards/day in the last fortnight, which is well above our average of 7.6. To give some background, the project figure is 56.1 cards/day for the last fortnight, made up by 12.6 from the Western Cape, 9.3 from KZN, 6.5 from Gauteng and the Eastern Cape, and 5.4 each from Mpumalanga and Limpopo. As such we compare quite well with the other provinces.
As in the last fortnight, our records/card figure has not dropped significantly either, we managed 52.5 records/card against 53.9 and 54.1 for the last two periods. The trend is definitely downward as expected as we go into winter, this is slower than usual though.
This last fortnight saw 27 cards submitted which contributed to the Cards-to-Green effort in KZN. This is nearly twice the number submitted for the previous fortnight. The daily average was 1.9 cards / day. The last time that we reached these heights was in January when we had four weeks of 2.0 / day.
These 27 cards included 15 second cards.
Well done KZN, especially for this time of year.
The most movement was in southern KZN, where a good number of pentads with a single card got their much needed second card. The next area of movement was in the inner coastal strip in Northen KZN.
The 3029 degree square benefited the most in this fortnight, gaining 11 cards, 10 of which were second cards.
The next biggest beneficiary was 2831 which got 7 cards, followed by 3030 with four.
We now need 1 540 cards for all of KZN to have four cards for every pentad.
The degree square needing the most coverage is still 2830, with 319 cards needed. This degree square still has three pentads with no data, 73 with only one card and 39 pentads with only 2.
Degree squares 2731 and 2732 both need 183 cards, with 2732 having seven pentads with no cover.
On the positive side 2832 now only needs 6 cards and 2931 sixteen.
Looking at who has contributed, again we have some new names on the merit list, with Johan de Villiers, Kelly Gate and Ronald Searle each contributing a single card. Ewert Hauptfleisch who has been on and off these lists for the last few periods, again managed to contribute a card as well.
The big honours this time go to Tim Wood and his team who contributed a whopping 16 cards, with all of them, barring one in 2930BA, in southern KZN.
John & Kim Cox continued their sterling and methodical work in Zululand with 7 cards.
Thanks to these observers for their great contributions.
Looking at the overall SABAP2 contributions for KZN, we had 85 cards submitted in the last fortnight, which at 6.1 cards / day is not our lowest daily rate, but was below our average of 7.9 cards/day. Really great to see that nearly a third of these were focused on the CTG effort.
Unfortunately we experienced our first real major dip in records per card in this period, dropping from 52.5 records/card last fortnight to 45.6 in this one. Winter appears to be setting in.
As is often the case in mid-autumn, contributions to the atlas project have a tendency to slow, and this last fortnight was no different.
We had 6 submissions which contributed to the KZN Cards-to-Green project, with most movement in the south for change.
As can be seen from the table, there was one submission each in 2730, 2830 and 2930, while 3030 benefited from 3 cards.
This leaves 2830 as the degree square still n need of the most cards, at 322 and three pentads with no data and 73 pentads with only one card.
The next two degree squares needing the most cards are 2732 needing 187 and 2731, which needs 184 cards. 2732 also has the single biggest block of empty pentads, with seven located in the north-eastern part of the iSimangaliso Wetland Park.
Tim Wood takes the honours this fortnight with 4 of the six cards, viz. the three 3030 cards as well as the one in 2930.
John Burchmore contributed the card in 2730 and Alan Taylor the one in 2830.
On the overall KZN front we had 4.2 cards submitted per day. The last time that we dipped to this level was in September to October 2012, when we experienced three successive fortnight's of 4.3, 4.9 and 3.6. At least the last two fortnight's just passed have had rates of 7.1 and 7.2 cards submitted / day.
Our records / card level is surprisingly holding up at 53.9, the last two fortnights have been 53.5 and 54.1. So while the card number have dropped, the records/card have not.


.png)